Data
Query with shell-style syntax and autocomplete, switch between table, tree, and JSON views, edit inline, build aggregation pipelines, and manage indexes.
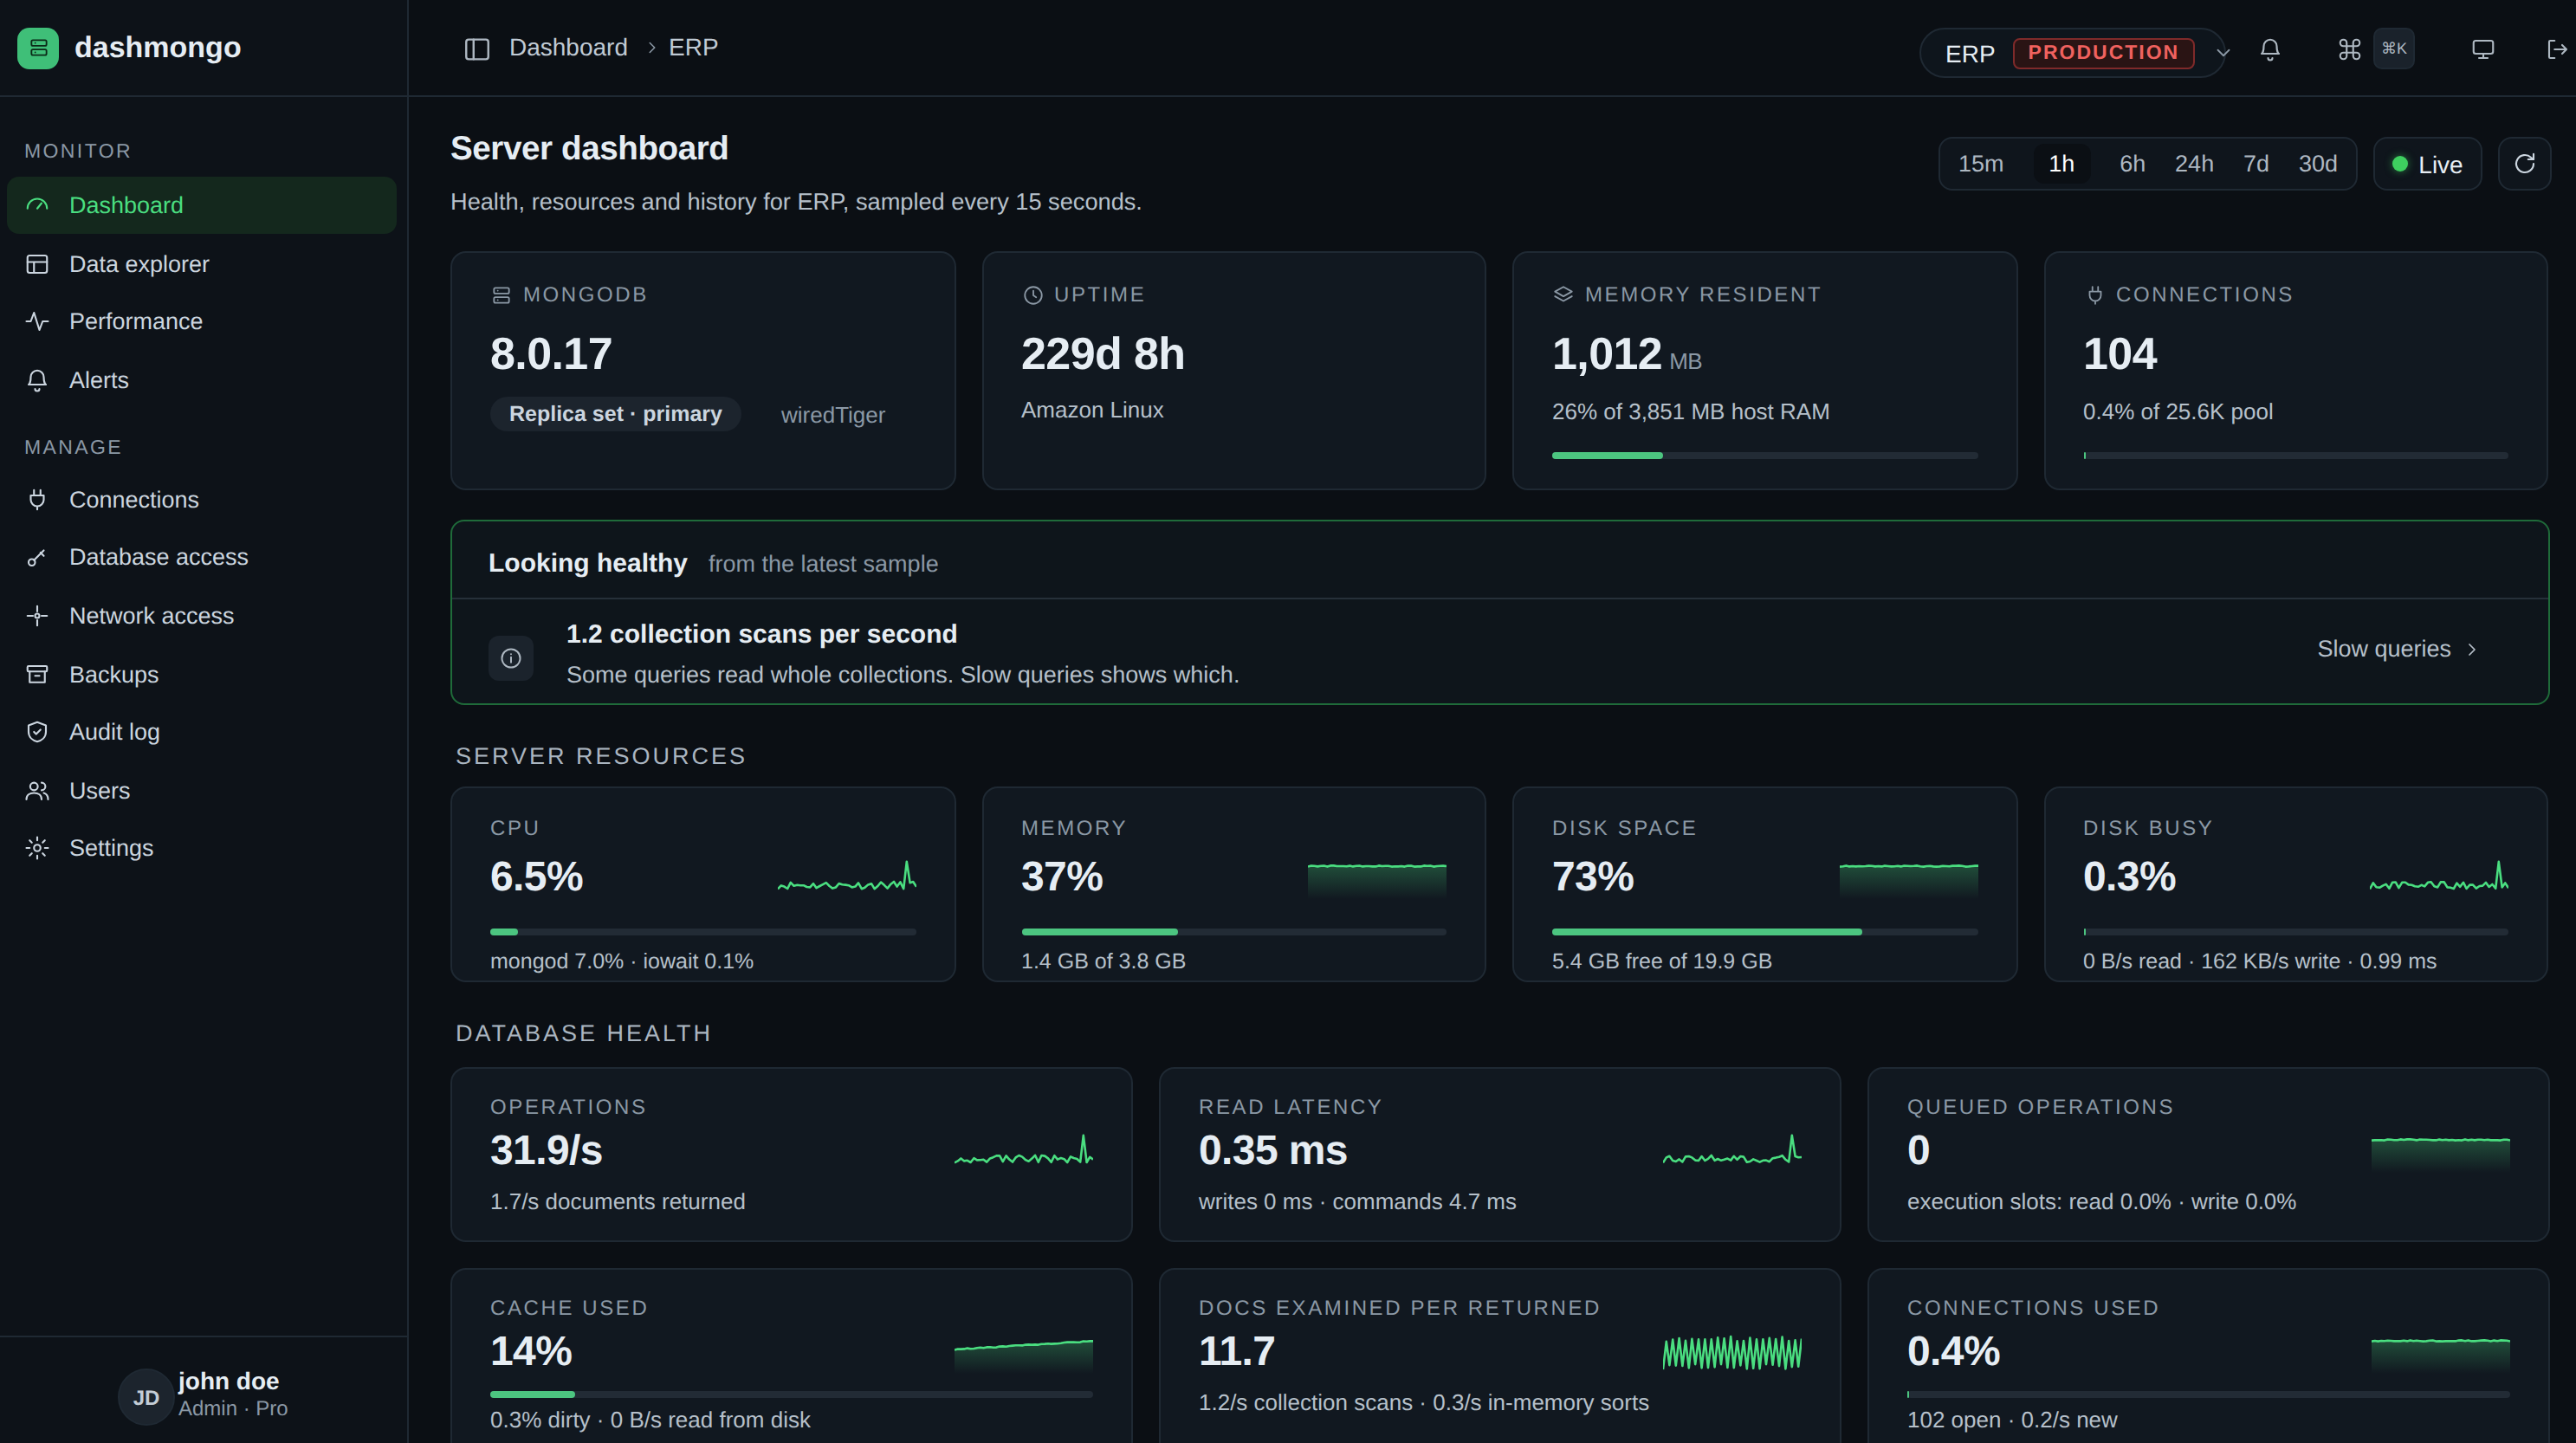
Browse and query data, watch server health, schedule backups, and manage users and access — all from one dashboard.
Why dashmongo
Data explorers cover browsing and querying. The rest of MongoDB admin — monitoring, backups, alerts, users, network access — usually means the shell or separate tools. dashmongo puts these in one dashboard, for any deployment you can connect to.
The workspace
From the first query to the post-mortem, the tools are there when you need them — and out of the way when you don't.
Query with shell-style syntax and autocomplete, switch between table, tree, and JSON views, edit inline, build aggregation pipelines, and manage indexes.
Live server health, running operations you can stop, a slow-query log, and replication status.
Scheduled or on-demand backups to S3 or R2, with browse-before-restore and partial restore.
A better way to work
Questions? ds801015@gmail.com